Advanced Account Schedules
User Guide
Feeling limited by the out-of-the-box financial reporting module in Dynamics 365 Business Central? If so, the Advanced Account Schedules App is here for you.
Quite often, the biggest shortcoming of the financial reporting module in Dynamics 365 Business Central reporting is the lack of non-G/L values. This means that getting AR, AP, inventory, even jobs or warehousing numbers into financial reporting can be challenging.
Dynamics 365 Business Central is filled with all the raw data you need to build great reports, but without being able to pull non-G/L data, you may be missing out on useful insights. Thankfully, the Advanced Financial Reporting App is here to help you take your reporting to the next level.
The Advanced Account Schedules allows you to access data from anywhere in Dynamics 365 Business Central, even data outside the G/L, making it possible to create a one-click KPI report or prepare everything for Excel or Power BI without having to juggle multiple data sources.
Benefits of the Advanced Account Schedules App for Dynamics 365 Business Central
The app provides many benefits to Dynamics 365 Business Central users, including the ability to:
- Access data from anywhere in Dynamics 365 Business Central, even outside the G/L
- Create comprehensive reports for Excel or Power BI without having to juggle multiple data sources
- Access draft data, making it possible to use quotes, orders and information from journals in reports
- Select single values or calculate sums and count records in a dataset
- Seamlessly integrate with existing account schedules functionality
How Does the Advanced Account Schedules App for Dynamics 365 Business Central Work?
The Advanced Account Schedules App fully integrates with the existing account schedules functionality in Dynamics 365 Business Central and allows you to easily pull in additional data using ‘Indicators’.
You define each ‘Indicator’, which has a method, table and filters associated with it.
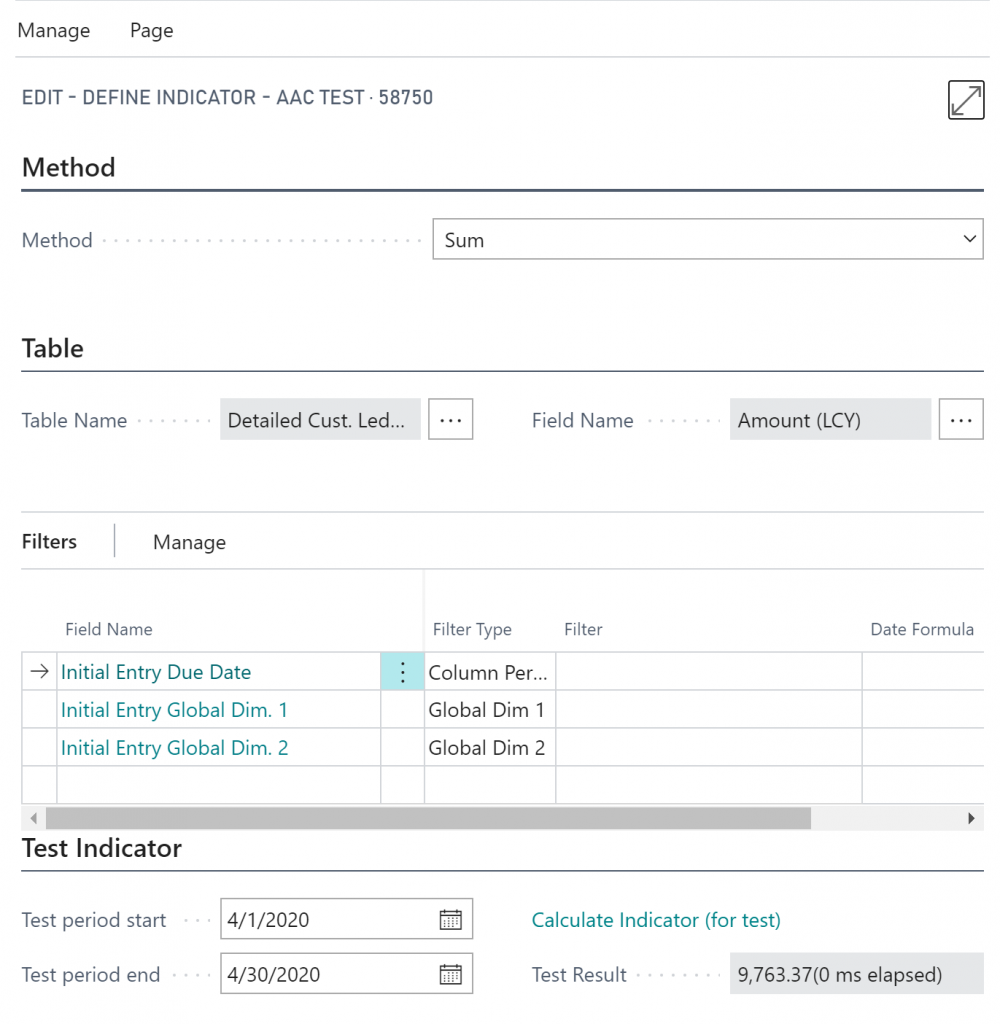
An Indicator that calculates balance due on customers (Using a SumFieldIndex)
The Advanced Financial Reporting App supports the following indicator methods:
- Lookup – Find any single value
- Sum – Sum all records within a filter of records
- Count – Count all records within a filter of records
- Min – The smallest value within a filter of records
- Max – The largest value within a filter of records
- Average – Calculate the mean value of all records in a filter
- Custom – Allow a developer to create custom indicators
Examples of indicators that can be created with Advanced Financial Reporting include:
- Number of invoices in a period
- Mean value of items sold
- Aging and due balances from AR and AP
- Customer count (filtered by region)
- The total sum of issued credit limits
- Split values on non-posting codes
- Outstanding quotes
- Open orders
- Job budget
- Draft entries in Job Journal
Advanced Financial Reporting App Functions for Dynamics 365 Business Central
Sums
There are two different “modes” when it comes to summing several records in a dataset. One of the core technologies in Dynamics 365 Business Central is called FlowFields. A FlowField is a way to calculate the sums of a large number of records in an instant. When selecting the Sum method, Advanced Financial Reporting will automatically figure out what method to use:
- Classic – Select any field in any table and let Advanced Financial Reporting calculate the sum. This can be performance heavy if there are many records within the filter specified.
- SumFieldIndex – If the field selected is the source behind a FlowField, then the calculation will use the same method as a FlowField to perform the summation lightning quick. This is the same as the Balance Due (LCY) field on the customer, but instead of adding up the balance for each customer, it’s a single calculation.
Lookup
A lookup indicator is great for locating a specific value, like the price of an item, a credit limit on a customer or perhaps a resource base rate. Lookup indicators are often used as hidden lines as a parameter to a formula.
Count
Counting records is a great performance indicator. The number of transactions for a period or the number of jobs are good examples.
Max/Min/Average
Finding the maximum value, or the minimum values are often used in statistics, and calculating the average document amount is also a useful indicator.
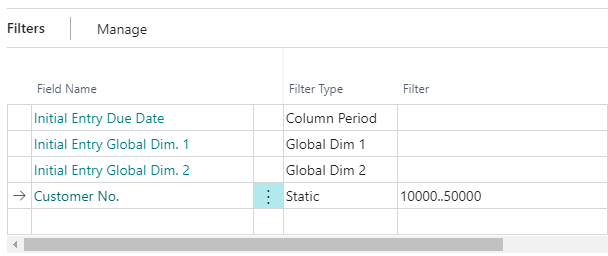
Filters
With the Advanced Financial Reporting App for Dynamics 365 Business Central, you can set filters on an Indicator to manage your data.
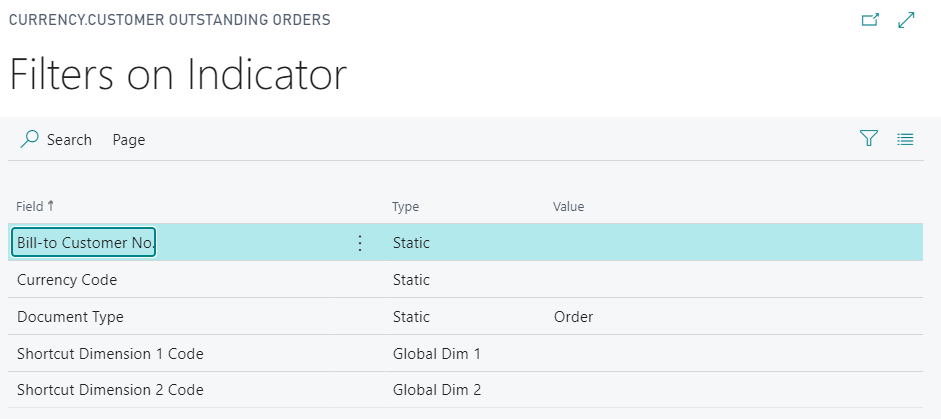
Setting filters on an Indicator
There are four different types of filters that you can choose to set on an Indicator:
- Static – This is a classic Dynamics 365 Business Central filter. You can use all the usual filtering syntax.
- Column Period – This will set a date filter defined by the column in the financial reporting module. The Row Type field is supported.
- Global Dim 1 – This will transfer the global dimension 1 filter from the financial report header.
- Global Dim 2 – This will transfer the global dimension 2 filter from the financial report header.
Only global dimension 1 and 2 are supported since they are the only dimensions represented as fields throughout Dynamics 365 Business Central.
Testing your Indicator
When setting up an indicator you have the option to test the indicator right from the indicator card to see that your filters are working and also to check the execution time. Some sum indicators can take a long time depending on how many records are within the filters.
Note: Locating a field with SunFieldIndex support is often the solution if an Indicator takes too long to execute.
Indicator Library
With the App comes an entire library of indicators that can be used directly, or serve as inspiration:
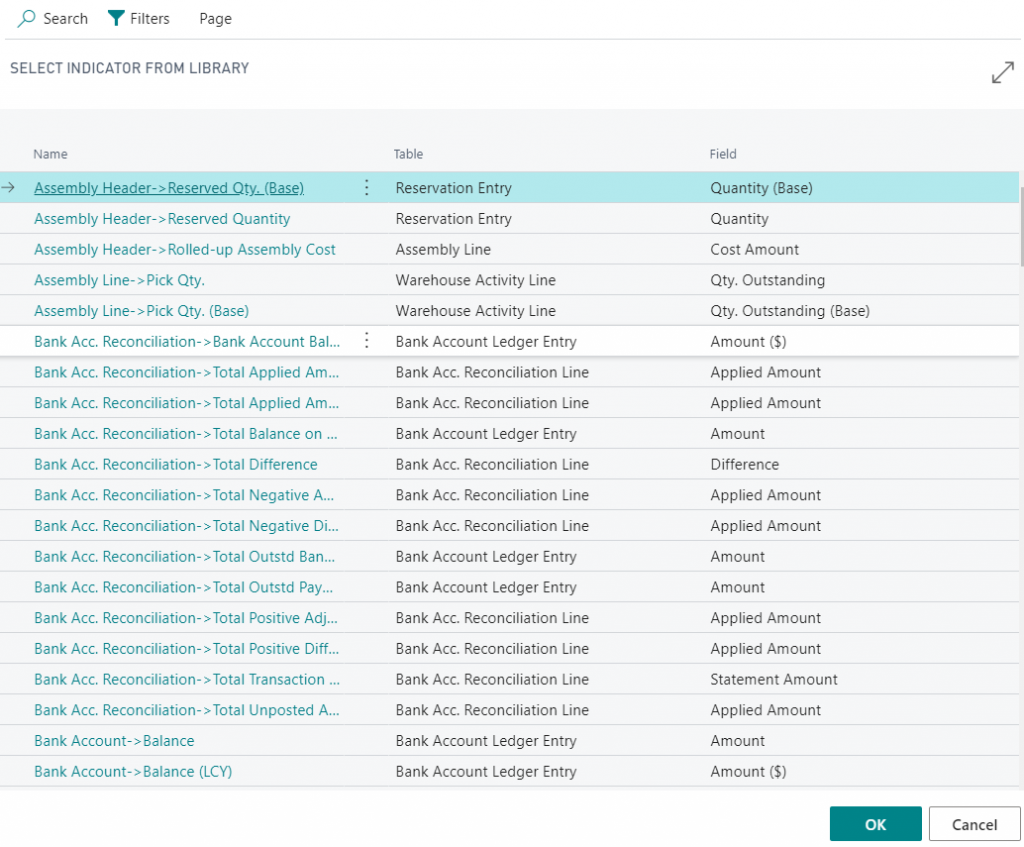
The indicator Library
Each indicator in the library comes with a set of the right filters to apply: